-
From
CGIAR Initiative on National Policies and Strategies
-
Published on
09.11.23
On July 19, 2023, the CGIAR Research Initiative on National Policies and Strategies initiated a blog competition, inviting all attendees of the Food Security Simulator Kenya demonstration to participate. The competition winner would be eligible for a short-term industrial attachment/mentorship at IFPRI’s Kenya office and the top three blogs would be published on the CGIAR Research Initiative on National Policies and Strategies site. After receiving numerous submissions, our panel of judges composed of international and country experts has chosen the top three blogs below:
Winner! Dorah Kwamboka Momanyi, Short-Term Effects of Food Price Shocks Ensuing Expiration of the Black Sea Grain Deal: A Food Security Simulation- Moses Mahugu, The Widening Food Gap in Kenya amid Serious Drought: A Cry for Policy Reforms on Food Security
- Kefa Simiyu, From Income and Food Price Shocks to Food [In]security in Kenya: A Simulated Scenario Analysis
*Any opinions stated in the blog are those of the author(s) and are not necessarily representative of or endorsed by the CGIAR.
By Moses Mahugu
The Global Hunger Index report ranked Kenya as one of the most at-risk countries in the world. Earlier in the year, the state of food insecurity in Kenya became conspicuously apparent following the effects of the war in Ukraine and intense drought, which destabilized the supply of staple foods and their prices. These shifts heavily impacted consumption practices in both rural and urban households. Dryland communities in Northern Kenya, for example, caved into pressures of drought, the intensity of which had not been seen in the last 40 years. There was a dire need to bridge the supply gap in staples, with the maize deficit alone reaching approximately 10 million 90kg bags. The public generally expected the national government to purchase available supply from farmers before resorting to imports. However, this alternative was not considered favorable even though it would guarantee adequate volumes in the short run while making economic savings. This decision was met with resentment from farmer groups and organizations that support small-scale farmers.
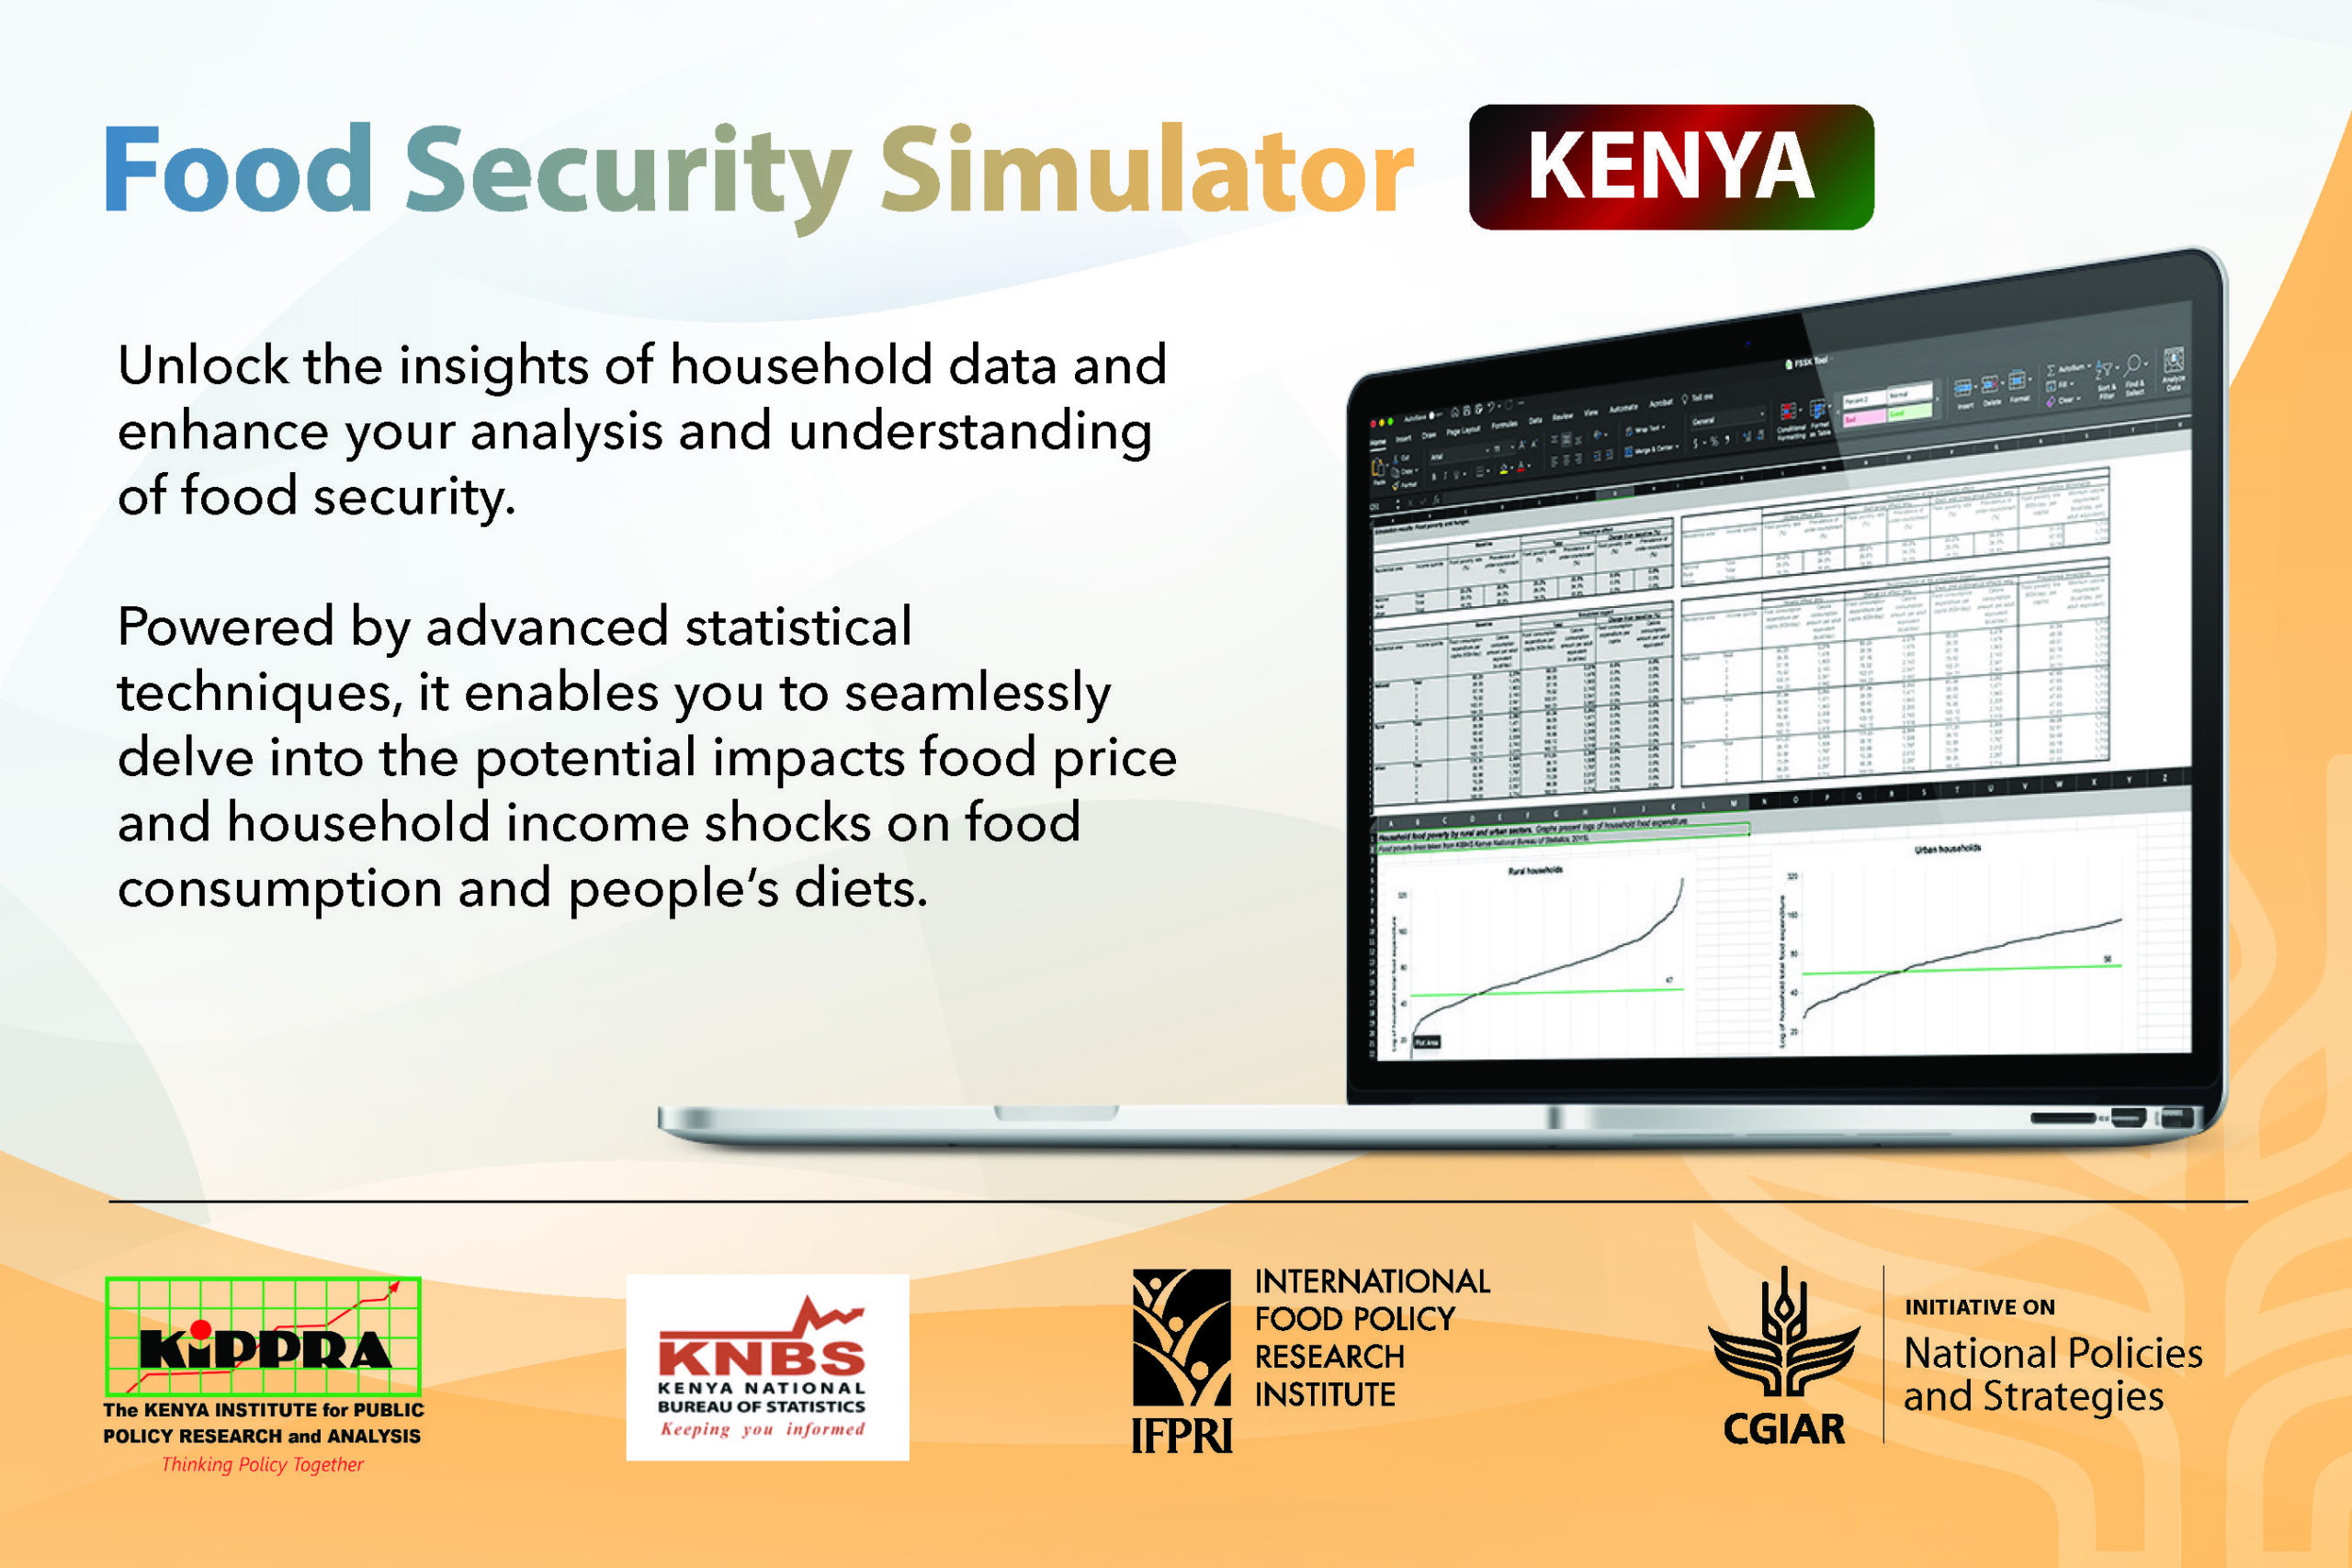
The Food Security Simulator-Kenya tool (FSSK)
This decision to import staple foods evoked pleas for the government to “make it, make sense” as ardent social media users would put it. This article analyzes the government’s decision and quantifies its potential implications. To understand the arguments that informed the government’s decision, I utilized the Food Security Simulator-Kenya (FSSK) tool to create evidence-based food security outcomes informed by changes in food prices and household incomes. The tool was created through a partnership of the Kenya Institute of Public Policy Research and Analysis (KIPPRA), the University of Nairobi, the International Food Policy Research Institute (IFPRI), and CGIAR.
Potential Gains in the Short Run from Importing Staples
The decision to import was based on the benefit of economies of scale and also the anticipated ripple effects to the population that would result from a reduction in the price of maize by 25 percent from 200 Kenyan shillings (Ksh) to Ksh150. Inputting this price decrease into the FSSK, resulted in a positive shift in various food security indicators.
For instance, the decision to import would improve access to food, which is indicated by a decrease in rates of food poverty and undernourishment by 1.4 percent and 3.5 percent, respectively (Table 1). Interestingly, urban households would be less food-poor than rural households. This may be explained by the difference in consumption patterns between urban and rural populations, where the former primarily consume maize in the form of packaged flour.
Table 1: Food Poverty and Undernourishment
| Simulated Impact (%) | Change from Baseline (% points) | ||
| Food poverty rate | National | 21.7% | -1.4% |
| Rural | 25.0% | -1.0% | |
| Urban | 17.3% | -2.0% | |
| Prevalence of under-nourishment | National | 31.4% | -3.5% |
| Rural | 29.9% | -4.4% | |
| Urban | 33.5% | -2.3% |
Lower food prices will stimulate an increase in household expenditures. Remarkably, people in the low- to middle-income brackets would see an average increase in their food budget by 1.4 percent. Additionally, people within the same income groups will consume more energy-giving foods with an average increase in calorie intake of 6.8 percent. This projection is related to the trend in starch deprivation, which declines from 21 percent to 13.7 percent.
Table 2: Food expenditure, consumption, and dietary outcomes
| Change from Baseline (% points) | |||||||
| Total | |||||||
| 1 | 2 | 3 | 4 | 5 | |||
| Food consumption expenditure per capita (KSh/day) | National | 0.5% | 1.9% | 1.5% | 0.9% | 0.2% | -0.1% |
| Rural | -0.9% | 1.6% | 0.9% | 0.1% | -1.1% | -3.7% | |
| Urban | 2.1% | 4.2% | 3.3% | 2.6% | 1.8% | 1.8% | |
| Calorie consumption amount per adult equivalent (kcal/day) | National | 5.0% | 7.1% | 7.1% | 6.2% | 4.6% | 2.9% |
| Rural | 5.7% | 7.3% | 7.5% | 6.8% | 5.3% | 2.3% | |
| Urban | 4.0% | 6.0% | 5.9% | 5.0% | 3.7% | 3.3% | |
| Change from Baseline | |||||||
| Total | Quintile | ||||||
| 1 | 2 | 3 | 4 | 5 | |||
| Diet quality indicator | National | 0.5% | 0.7% | 0.9% | 0.4% | 0.5% | 0.0% |
| Rural | -0.5% | -0.3% | 0.2% | -0.3% | -0.2% | -1.9% | |
| Urban | 2.1% | 2.6% | 2.0% | 1.6% | 2.0% | 2.5% | |
| Average adequate food groups | National | 8.7% | 17.7% | 12.9% | 9.5% | 2.6% | 5.9% |
| Rural | 8.4% | 21.4% | 8.5% | 12.4% | 1.1% | 5.0% | |
| Urban | 9.2% | 10.4% | 22.1% | 5.2% | 5.7% | 7.2% | |
| Share of deprived households with sufficient food consumption | National | 3.7% | 2.0% | 3.8% | 4.0% | 5.7% | 2.8% |
| Rural | 4.9% | 1.1% | 4.9% | 6.5% | 7.9% | 3.7% | |
| Urban | 1.3% | 4.0% | 1.4% | -0.5% | 0.8% | 1.5% | |
Imports of food supplies will also drive an increase of approximately 4.9 percent in food sufficiency for rural households previously labelled food-deprived. However, only 1.3 percent of urban households of similar income will become food sufficient.
The potential increase in food consumption can also be perceived through the diet quality indicator. The tool predicts that urban households will spend 2.1 percent more money on food due to their preference for high-quality diets. Furthermore, they will consume a wider variety of foods (9.2 percent) compared to rural households (8.4 percent).
Thus, evidence shows that the decision to import is justified due to the improved access, availability, stability, and use of food by the wider population. Analysis from the FSSK tool does not necessarily argue for importation, but rather, increased supply of staples in the country. Therefore, policymakers should create policies that encourage farmers to increase production of staple crops by not only subsidizing production but also guaranteeing market access. Doing so would impact households’ food security, health and wellbeing, and the economy as a whole.
About the author:
Moses Mahugu (mosesmahugu1826@gmail.com)
This work is part of the CGIAR Research Initiative on National Policies and Strategies (NPS). CGIAR launched NPS with national and international partners to build policy coherence, respond to policy demands and crises, and integrate policy tools at national and subnational levels in countries in Africa, Asia, and Latin America. CGIAR centers participating in NPS are The Alliance of Bioversity International and the International Center for Tropical Agriculture (Alliance Bioversity-CIAT), International Food Policy Research Institute (IFPRI), International Livestock Research Institute (ILRI), International Water Management Institute (IWMI), International Potato Center (CIP), International Institute of Tropical Agriculture (IITA), and WorldFish. We would like to thank all funders who supported this research through their contributions to the CGIAR Trust Fund.