-
From
CGIAR Initiative on NEXUS Gains
-
Published on
03.05.24
- Impact Area
By Upali A. Amarasinghe, Madhusha Perera, Alok Sikka, Rabindra K. Panda, Arjamadutta Sarangi, Jonathan Lautze, and Surajit Ghosh
With increasing water scarcity, assessment metrics like water productivity (WP) and water footprints (WFP) will receive greater attention as tools to inform policy dialogues and guide practical decisions. However, these indicators often omit critical nuances such as spatial and temporal variation. A lack of information related to these nuances hinders water management, ultimately making water use less efficient than it could be and reducing the cross-sectoral benefits that could be derived from more efficient use.
In India, the Central Ground Water Board (CGWB) estimates groundwater extraction at the block/district level and compares it with the extractable groundwater resources to assess the severity of groundwater overexploitation. This is the primary information available to decision-makers. However, detailed information on the contribution of groundwater irrigation of different crops to the water–energy nexus or on the socio-economic and environmental benefits or costs they generate is lacking. The Water Productivity Atlas helps to fill this gap.
A one-stop shop for water productivity
The Water Productivity Atlas, developed by the International Water Management Institute (IWMI) in partnership with the Indian Council of Agricultural Research under the CGIAR Initiative on NEXUS Gains, is a one-stop shop for visualizing WP and WFP of different crops, cropping patterns, and agricultural systems. Indicators include physical WP (kg/m3), economic WP ($/m3), nutritional WP (calorie, proteins, fat/m3), and blue and green WFP (m3/tonne). The blue WFP includes consumptive water use from both surface and groundwater. The online tool (https://indiawpatlas.shinyapps.io/wpatlas/) depicts indicators’ spatial and temporal variation across administrative units or river basins.
The components
The India Water Productivity Atlas can display the WP and WFP trends of more than 30 crops, four cropping systems, and crop–milk production systems, as well as the spatial variation across 596 districts in 32 states, and 94 sub-river basins in 19 major river basins. It has four components: Trends, Comparisons, Scenarios, and the Nexus.
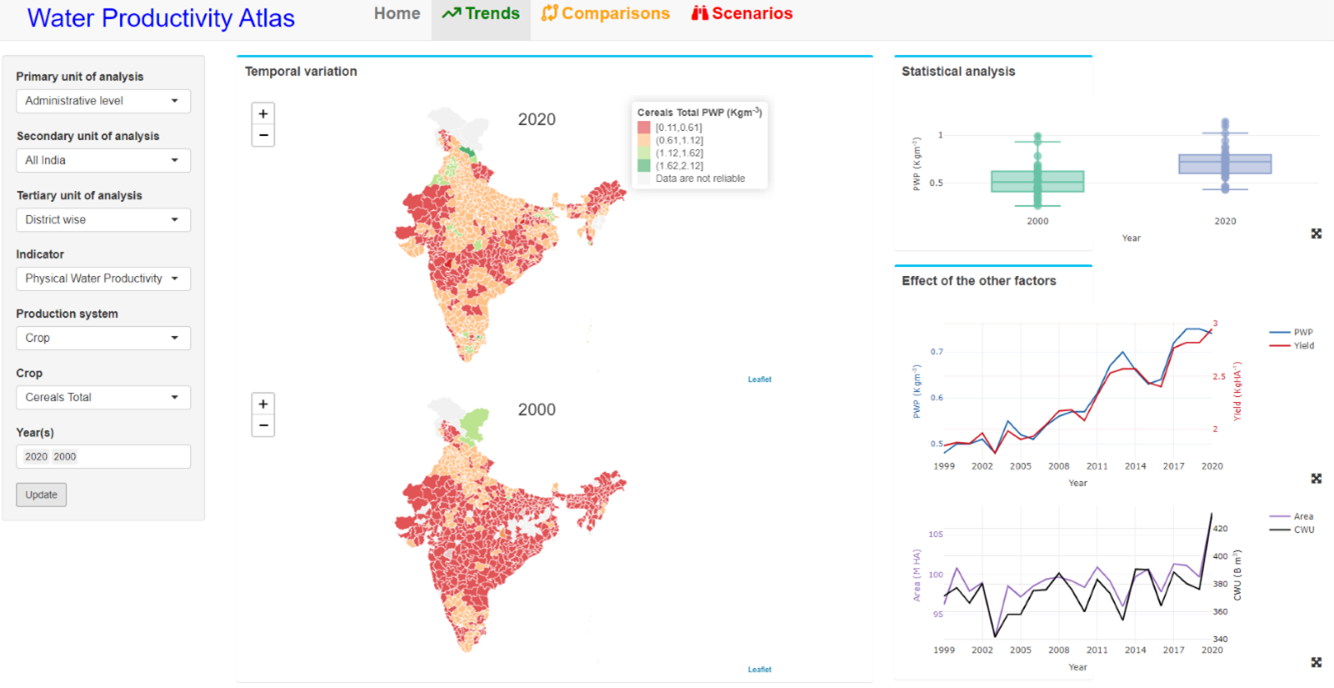
The Trends component depicts the spatial variation for a selected year or compares the patterns across two years. It shows the aggregate picture at the national, state (major river basins), or district (sub-river basins) level, depending on the unit selected at the secondary and tertiary levels. In Figure 1, the interface shows the selection of primary, secondary, and tertiary geographical units (administrative, all India, and districts), indicator (physical WP), crop (cereal), and periods (2000 and 2020) to show the change in the spatial variation of physical WP of cereals. It also shows the temporal variation of physical WP and factors related to it.
The Comparison component depicts WP and WFP variation across administrative regions and river basins. Such comparisons are useful for benchmarking performance across spatial units. Economic WP comparison of crops can assess the potential for crop diversification.
The Scenario component shows potential options for addressing the water–energy–food–ecosystems nexus or the water use and financial impacts of crop diversification in different units. For example, in the Ambala district, Haryana, rice, wheat, and sugarcane contribute to 98 percent of the total groundwater footprint, which is 104 percent of the extractable groundwater resources. Crop diversification from high water-consuming crops of sugarcane and rice is necessary for addressing the groundwater over-exploitation in the district.
Take the example of a new cropping pattern, which includes:
- reduced groundwater irrigated area of rice from 85,000 ha to 65,000 ha
- reduced groundwater irrigated area of sugarcane from 11,000 ha to 6,000 ha
- increased groundwater irrigated area of sunflower from 9,000 ha to 29,000 ha
- increased groundwater irrigated area of vegetables from 2,000 to 7,000 ha
This reduces the groundwater footprint from 104 percent to 90 percent of the extractable groundwater resources and increases the value of production from USD 397 million to USD 420 million. This in turn increases economic WP from 0.92 to 0.98 USD/m3, while maintaining substantial nutritional surpluses. Planners can select an agronomically suitable alternative cropping pattern to reduce groundwater overexploitation without having a major impact on the nutritional surplus/deficits and value of production.
The Nexus component shows spatial variation of the groundwater WFP of all crops as a percentage of extractable groundwater resources estimated by the CGWB and the nutritional (calories, protein, and fat) surplus or deficit as a percentage of consumption at the district level. This component informs whether unsustainable groundwater use contributes to production surpluses or deficits in a district, which is useful for deciding whether to follow the business-as-usual scenario or increase trade, that is, virtual water imports or exports.
By providing a more granular and focused identification of trends, the Water Productivity Atlas can help decision-makers formulate targeted strategies that optimize impacts across the nexus. Different versions of the Atlas were presented to Indian researchers and government officials in New Delhi in August 2022 and October 2023 for feedback. The need for information and decision support tools, such as the Water Productivity Atlas, to help manage increasingly scarce water resources, was made by participants at both events.
Next steps
IWMI plans to collaborate with and build the capacity of India’s Ministry of Agriculture and Ministry of Water Resources to use the tool to develop scenarios to understand the linkages and address the challenges in water–agriculture–food systems. IWMI will present the tool to ministry officials to inform them of its contents and capabilities before training a group of personnel from these ministries to use and pilot the Atlas by developing potential use cases.
The ultimate aim is that the Water Productivity Atlas has a home in Indian institutions such as the Ministries of Agriculture and Water Resources for dynamic upgrading with new data.
Upali A. Amarasinghe, Madhusha Perera, Jonathan Lautze, Alok Sikka, and Surajit Ghosh are researchers at IWMI. Rabindra K. Panda and Arjamadutta Sarangi are scientists at the Indian Institute of Water Management.
This work was carried out under the CGIAR Initiative on NEXUS Gains, which is grateful for the support of CGIAR Trust Fund contributors: staging.cgiar.org/funders
See Upali Amarasinghe’s presentation on the Water Productivity Atlas in this NEXUS Gains webinar.
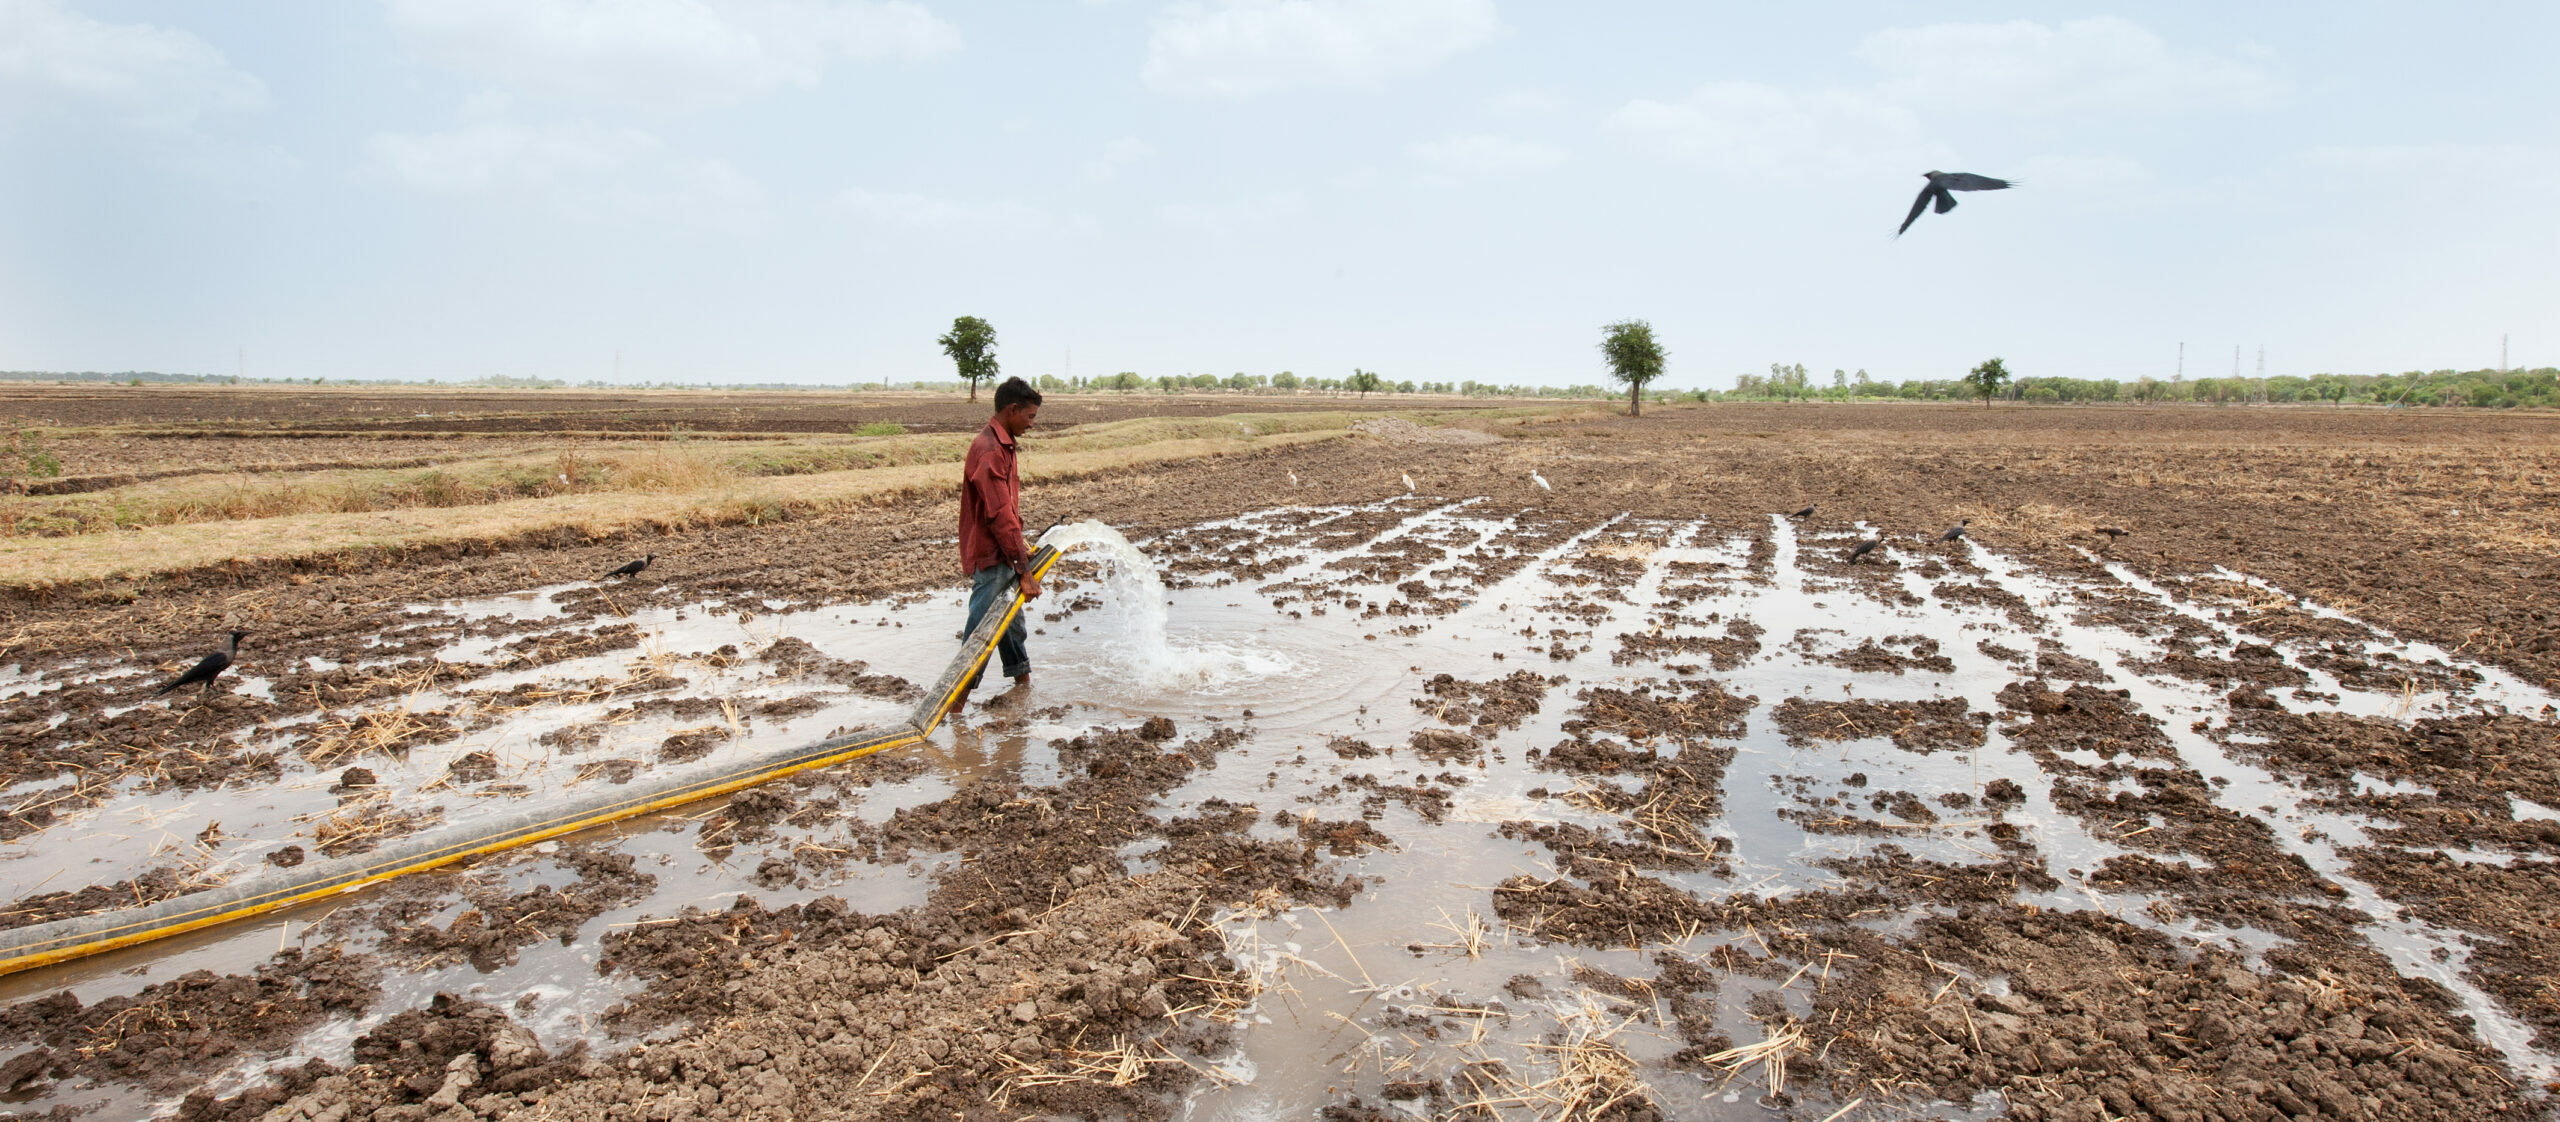
Header image: Laying pipes for irrigation. Photo by Tanmoy Bhaduri/IWMI.
Related news
-

ICRISAT to Deliver World-Class Services as CGIAR’s Breeding Resources South Asia Hub
07.07.25-
Biodiversity
-
Food security
Strategic collaboration to scale innovation and deliver harmonized, high-quality support across CGIA…
Read more -
-

Multifunctional Landscapes that reconcile food production, with ecosystem restoration and biodiversity conservation
06.07.25-
Biodiversity
-
Environmental health & biodiversity
The CGIAR Multifunctional Landscapes Science Program (MFL SP) is driven by a bold vision of…
Read more -
-

Harnessing digital tools in securing soil health for Africa’s food future
27.06.25-
Climate adaptation & mitigation
-
Environmental health
-
Nutrition, health & food security
-
Poverty reduction, livelihoods & jobs
Nairobi, 27 June 2025 (IITA) - As it marks its first anniversary, the Regional Hub…
Read more -